
Australia’s Group 1 obsession continues
With a record number of Group 1 starters to this point of the Australian racing season, By The Numbers digs into the upward trend of field sizes for the elite races.
Tomorrow’s Turnbull Stakes (Gr 1, 2000m) represents the tenth Group 1 of the Australian racing season and with 16 runners and two emergencies, the race is set to have its first capacity field for nine years.
The Turnbull Stakes, first run as Group 1 race in 2006, has long been a crucial race of the Melbourne spring, with its set-weights plus penalties structure providing a point of difference to the weight-for-age features dotted around it through the early spring.
With an honour board since 2000 featuring names such as Sunline (Desert Sun), Northerly (Serheed), Makybe Diva (Desert King) and Winx (Street Cry) (twice), it has proven a successful stepping stone to the Cox Plate (Gr 1, 2040m), while also providing an incentive for those plotting a path to the major spring handicaps.
In the ten years after it was upgraded to a Group 1, the average field size was 14.9, with plenty of competition for spots in the first 2000-metre feature of the season. However, from 2016 to 2021, the average field size for the Turnbull dropped to just 10.7.
The decision of Racing Victoria to double the Turnbull’s prize–money to $1 million for 2021 no doubt was influential in a jump in numbers to 15 last year and while it has dropped back to $750,000 this year, there is a full field of 16.
Significantly, it is being used as the spring launching point for two international spring raiders, Hong Kong star Romantic Warrior (Acclamation) and Irish-bred and English-trained West Wind Blows (Teofilo).
The 16-strong field for tomorrow’s race will mean that across the first ten Group 1 races of the Australian season there have been 133 runners, a record total for that collection of races.
As a point of comparison, the total numbers for those ten races last year was 112, while it was 122 in 2022 and 132 in 2020. The average total field numbers over the past ten years for those ten races has been 119.2, indicating the level of enthusiasm for Group 1 racing is higher than ever.
Total starters for selected ten Group 1 races since 2014
| Year | Total Starters |
| 2023 | 133 |
| 2022 | 112 |
| 2021 | 122 |
| 2020 | 132 |
| 2019 | 123 |
| 2018 | 124 |
| 2017 | 104 |
| 2016 | 109 |
| 2015 | 128 |
| 2014 | 112 |
Included races: Turnbull, Epsom, Metropolitan, Moir, Flight, Golden Rose, Makybe Diva, Underwood, Memsie and Winx.
This is a fascinating development considering the freezing of the Australian pattern over the past four years has meant there have been no further Group 1 races added to the calendar. When you consider that the political challenges at Racing Australia are partially because of ‘pop-up’ races and their impact on the traditional racing program, the enthusiasm for Group 1s is clearly undiminished.
Of the nine Group 1 races run, seven of them have had fields above their average size for the past decade. The Underwood Stakes (Gr 1, 1800m) is the standout, attracting a field of 15 this year, 5.4 higher than its decade average and nine more than fronted up last year, when it was staged at Sandown.
The Melbourne Racing Club’s decision to bring the race back to Caulfield for the first time in three years and to give it a clear place in the calendar has clearly resonated with trainers in terms of their spring planning. The fact it dropped from $1 million back to $750,000 this year had no impact on the enthusiasm for the race.
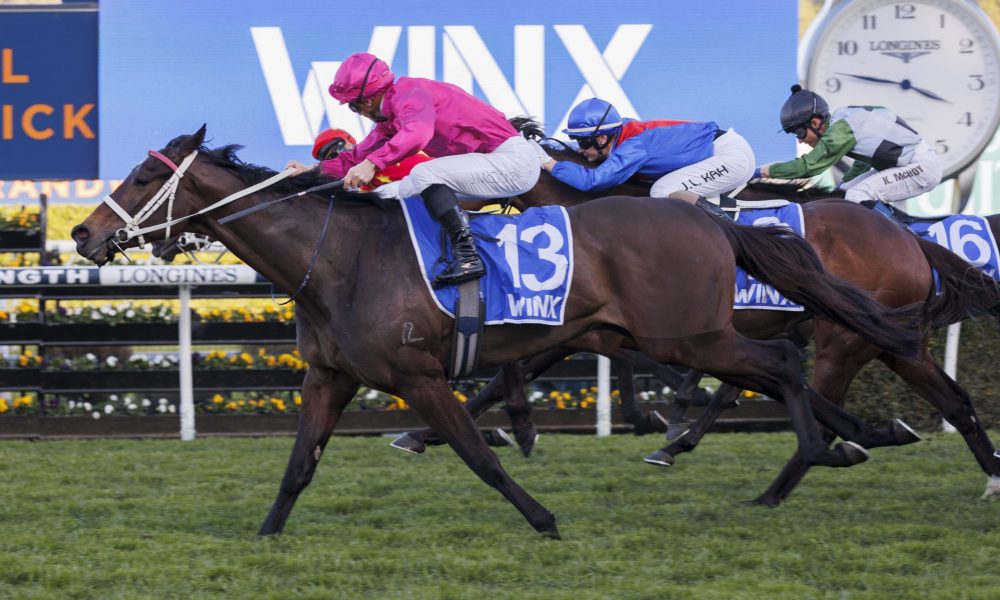
The Winx Stakes (Gr 1, 1400m), which as well as being the first Group 1 of the season, is also the most recently upgraded elite-level race, also had a significant jump in field size this year. Across the past decade, the Winx, or Warwick Stakes as it was previously known, had averaged a field size of 11.1.
This year, a field of 16 contested the race, which was run for $1 million for the first time and won by Fangirl (Sebring). That was six more than ran in the race last year and the equal highest field, along with 2020, in its history.
While the extra $250,000 no doubt proved a lure, when you consider the multiple changes and new ‘non black-type’ feature races added to the Sydney spring, that you can get a full field to a weight-for-age-race over 1400 metres in August clearly illustrates the ongoing enthusiasm for Group 1 contests.
It’s also worth noting that Sydney has endured a torrid run of wet weather and heavy tracks prior to this year, which would have no doubt also impacted field sizes over recent seasons.
The Epsom Handicap (Gr 1, 1600m) was in prime position to be disrupted by the move of the George Main four weeks forward to Everest day to become the $5 million King Charles Stakes (Gr 1, 1600m). But, on field size numbers at least, this did not prove to be the case, with Rediener (Redoute’s Choice) leading home a field of 18, the biggest for the race in five years and 2.7 more than the ten-year average.
The Flight Stakes (Gr 1, 1600m) was also staged at Randwick last Saturday and attracted a field of 12, 2.3 more than the ten-year average and the third biggest field since 2007. The third feature on that race program, The Metropolitan (Gr 1, 2400m) had a field of 15, slightly above the decade average of 14.8.
The other two Group 1 races to have had higher fields than average were the Golden Rose Stakes (Gr 1, 1400m) – 12 compared to 11.7 – and the first Melbourne Group 1 of the season, the Memsie Stakes (Gr 1, 1400m), with a field of 14 for the second-straight year, 1.5 more than it has averaged since 2014.
The two which had their fields fall short of the average were both in Melbourne. The Moir Stakes (Gr 1, 1000m), run last Friday night, attracted eight starters, its lowest since 2014 and 2.9 below its average of 10.9 from that point.
The Makybe Diva Stakes (Gr 1, 1600m) had the smallest Group 1 field of the season to date with just seven starters, its lowest since being upgraded in 2013. That was 4.9 below its ten-year average of 11.9 and a dramatic drop from the 16 who ran in the race in 2020.
Field sizes for selected Group 1 races
| Race | 2023 | Five-year average | 10-year average |
| Turnbull Stakes | 16 | 13.2 | 12.6 |
| Flight Stakes | 12 | 9.8 | 9.7 |
| Metropolitan Hcp | 15 | 15.2 | 14.6 |
| Epsom Hcp | 18 | 16.2 | 15.3 |
| Moir Stakes | 8 | 11.6 | 10.9 |
| Underwood Stakes | 15 | 9.4 | 9.6 |
| Golden Rose Stakes | 12 | 11.4 | 11.7 |
| Makybe Diva Stakes | 7 | 11.6 | 11.9 |
| Memsie Stakes | 14 | 13 | 12.5 |
| Winx Stakes | 16 | 13 | 11.1 |
| Average | 13.3 | 12.4 | 12.0 |